By Marianne.EP
A simplistic explanation by our engineer at Hujanpera
What is one-way ANOVA?
ANOVA stands for Analysis of Variance, and as the name suggests, it helps us understand and compare variances among groups.
One-way ANOVA is a statistical method that is commonly used when there is a single factor (independent variable) and you want to see if variations or different levels of that factor have a quantifiable effect on your measured response (dependent variable)
What are some of ANOVA’s limitations?
ANOVA requires that the response in each group be normally distributed and that the variation within groups be comparable across groups. It is only used to examine the impact of a single factor on a single dependent variable. When comparing the means of three or more groups, it can only tell us if at least one pair of means differs significantly, but not which pair.
Take not that, non-normal distribution data can be analyzed using a variety of statistical methods. These are known as non-parametric comparisons. You can use All-Pairs Tukey, HSD, or Steel with Control analysis to determine which pair has a significant difference or to compare results to a defined control group. These are available in the SAS JMP Software and can also be accomplished with R Programming.
An example of a one-way ANOVA
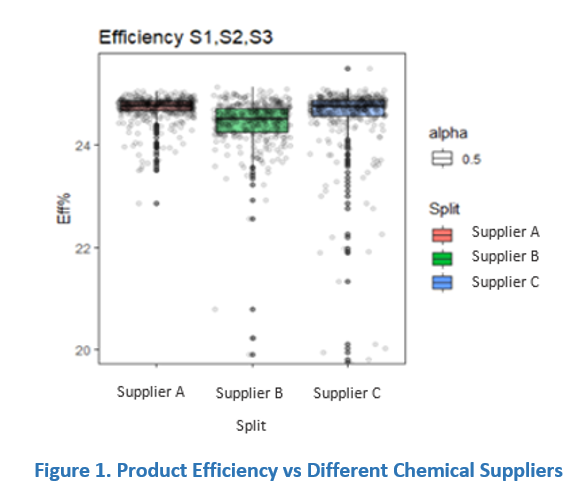
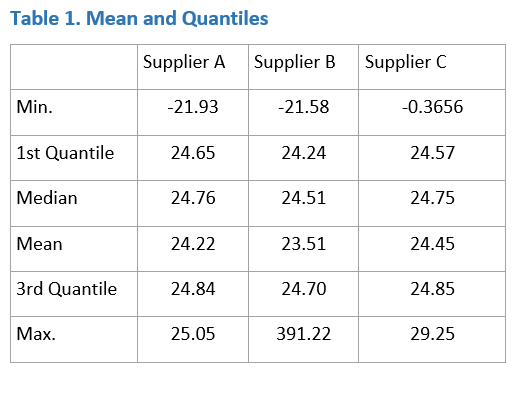
Let’s look at an example to better understand ANOVA. Assume you’re part of a team looking into a yield issue involving a reported drop in product efficiency when switching chemical batches. You plot the data from measuring the product efficiency of randomly selected cells from three different chemical batches. RMarkdown is used in this example to perform a boxplot, calculate measures of central tendency, and perform One-way ANOVA.

The boxplot shows that the measurements from Supplier B group are lower than those from Suppliers A and C. You then made the decision to compute the Mean and Quantiles for each group.
Using one-way ANOVA results, assess whether there is a statistical difference in product efficiency as the chemical supplier changes.

The ANOVA Table
ANOVA results, typically displayed in an ANOVA table, include:
- Source – sources of variation including the factor and the residuals/error
- DF – degrees of freedom
- Sum Sq – Sum of Squares (SS) for each source of variation
- Mean Sq – Mean Square; SS divided by its associated DF
- F Value – or F ratio; the mean square of the factor divided by the mean square of the error
- Pr(>F) – or Prob > F; the p-value

The key element in this table is the Pr(>F) or the p-value. The p-value is what we will use to test our hypothesis. For One-way ANOVA:
H0 (null hypothesis) = all means are the same
H1 (alternative hypothesis) = not all means are equal
A p-value lower than the threshold (usually 0.05 for 95% confidence interval), means that there is very low evidence that the means are the same. In our example, the p-value is 0.317 and this value is greater than the threshold. This means that for this dataset, there is evidence to accept the null hypothesis and state that there is no significant difference in product efficiency among different chemical suppliers.
Based on this result, you might write in your report: the product efficiency from randomly selected cells coming from 3 different chemical suppliers were measured. One-way ANOVA shows there is no significant difference (p-value = 0.317) in the product efficiency across different chemical suppliers. We can rule out chemical supplier and shift investigation on other factors to verify the reported efficiency drop.
If this sounds interesting to you, simply get in touch with Hujanpera. We will do our best to provide the best data analytical and analysis services, from consultations to report presentations.
Contact our HUJANPERA team for professional data-driven statistical services. Visit our project page for further example on completed jobs.